· 5 min read

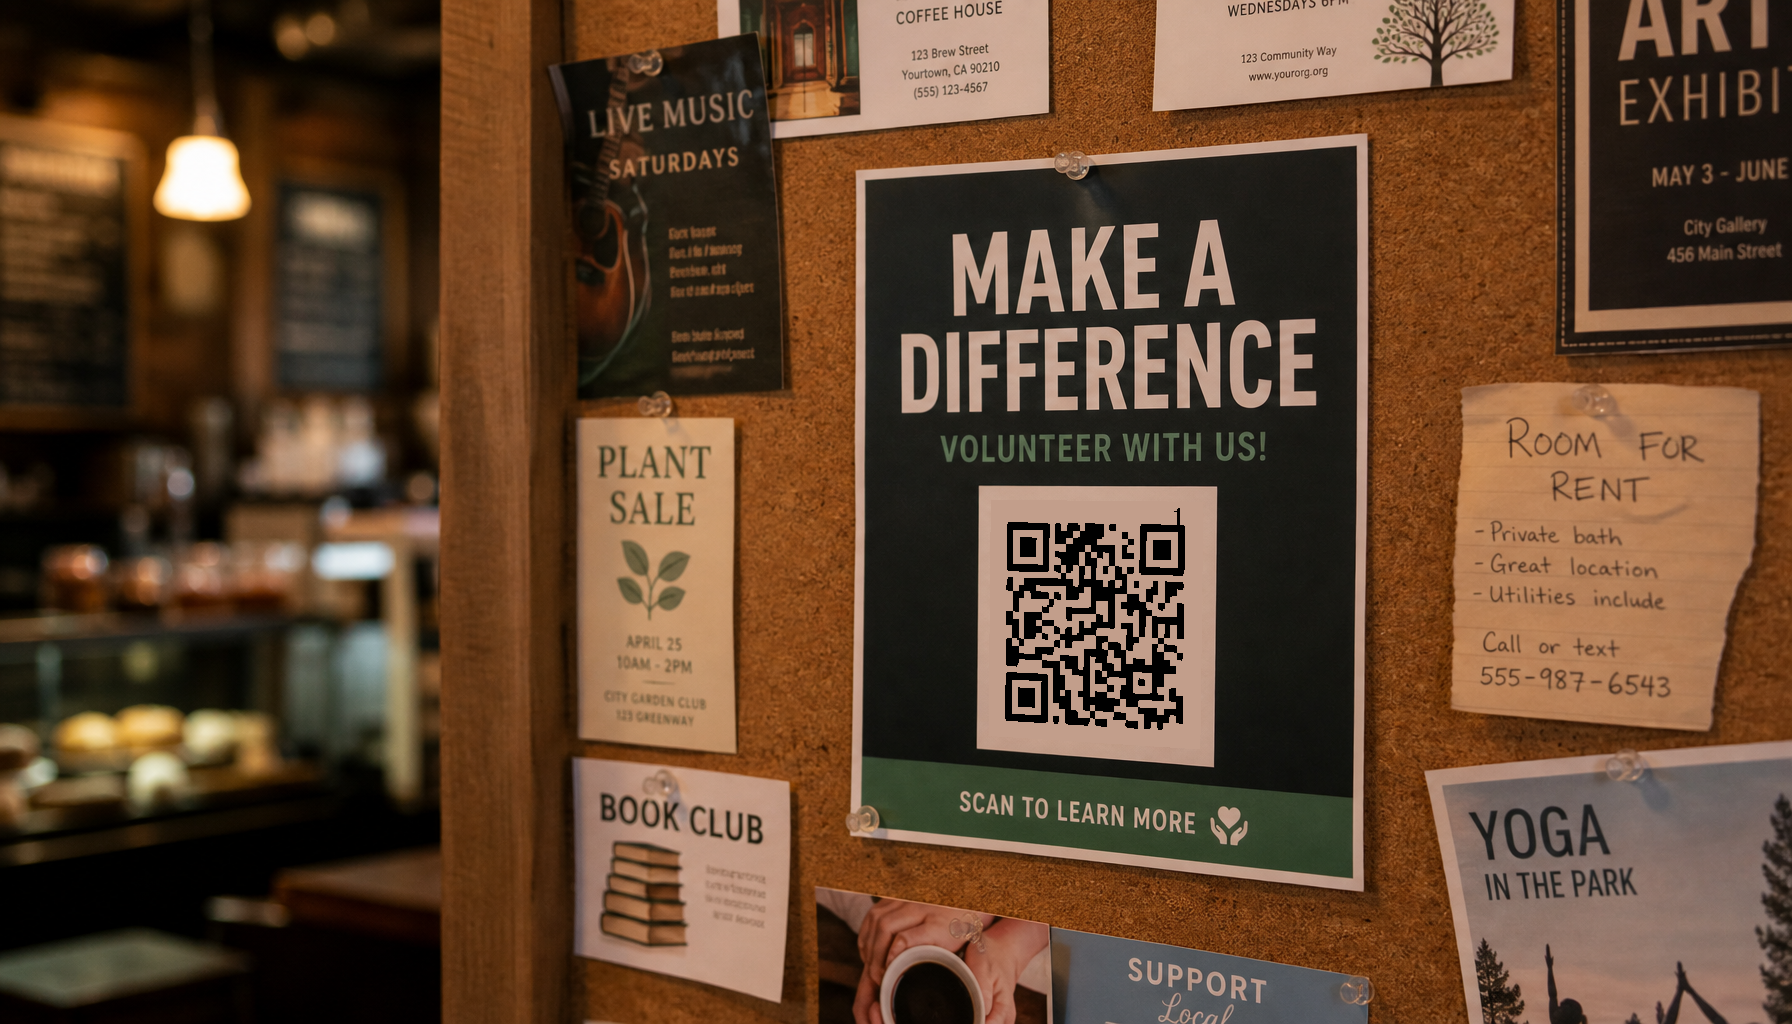
Community bulletin boards are one of the most underrated marketing channels. They're free or cheap, they're trusted by locals, and they exist in places where people already gather: coffee shops, libraries, gyms, churches, and community centers.

But most businesses treat bulletin boards like a lottery. They put up a flyer, hope for the best, and never know if it worked.

That doesn't have to be the case.
Hero image

Why Bulletin Boards Still Work​

Bulletin boards survive in the digital age because they serve a specific purpose: they reach people in a physical, local context.

Someone standing in line at a coffee shop has time to look. A parent at the library notices a flyer for a kids' event. A gym member scans a poster for a local race.

These are not random impressions. They are contextually relevant, geographically targeted, and often high-intent.

The problem has never been the channel. The problem has been the measurement.

The Traditional Approach: Spray and Pray​

Most bulletin board campaigns look like this:

  1. Design a flyer
  2. Print 50 copies
  3. Drive around town putting them up
  4. Wait and hope
  5. Maybe get some calls or website visits
  6. Have no idea which board produced what

This approach makes it impossible to improve. Was the coffee shop board better than the library? Did the design matter? Was it worth the time to drive across town?

Without data, every campaign starts from zero.

A Data-Driven Approach​

A data-driven bulletin board campaign has four steps:

1. Choose Boards Intentionally​

Not all boards are equal. Track which ones perform over time. Variables to consider:

  • Foot traffic
  • Audience match
  • Board visibility
  • Competition from other flyers
  • How often the board is cleared

Start with 5–10 boards and expand based on results.

2. Use Unique QR Codes per Board​

This is the most important step. Every board gets its own QR code.

Why? Because then every scan tells you something specific:

  • Which boards get scanned
  • Which days and times are most active
  • Which designs or offers perform best
  • When a flyer has been covered or removed

3. Point to a Relevant Landing Page​

The QR code should go somewhere useful, not just your homepage.

Examples:

  • Event flyer → event RSVP page
  • Service business → booking page
  • Product flyer → product page with a special offer
  • Recruitment flyer → application or signup form

Use UTM parameters so your analytics tell the full story:

https://yoursite.com/event?utm_source=flyer&utm_medium=qr&utm_campaign=summer&utm_content=library-board

4. Review and Iterate​

After two weeks, look at the data:

  • Which boards outperformed?
  • Which designs got more scans?
  • Did weekday or weekend placement matter?
  • Should you drop any boards?

Use the answers to make the next campaign better.

What the Numbers Look Like​

Here is a realistic two-week result from a 5-board test:

BoardScansFlyer CostCost per Scan
Downtown coffee shop34$2$0.06
Neighborhood grocery store27$2$0.07
Gym near main street18$2$0.11
Community center9$2$0.22
Library5$2$0.40

The total spend is about $10 in flyers and a few hours of driving. Without tracking, you would not know that the coffee shop and grocery store produced 61 of your 93 scans. You might keep all five boards and waste effort on the library and community center.

With tracking, your next cycle is simple: drop the bottom two boards, test two new locations, and run the same comparison again. Each cycle makes the channel cheaper and more effective.

What Makes a Good Bulletin Board Flyer​

Bulletin board flyers compete for attention. A good one:

  • Has a clear headline from 3 feet away
  • Includes a large, scannable QR code
  • Uses high contrast and minimal text
  • Has one clear call to action
  • Looks professional but not corporate
  • Includes a date or expiration when relevant

People decide whether to engage in seconds. Make it easy for them.

Tools for Tracking Bulletin Boards​

  • Spreadsheet: Log each board, flyer version, and placement date
  • QR code generator: Create unique codes
  • Google Analytics: Track landing page visits
  • Yap.Ad: Purpose-built for tracking physical placements with QR codes, location logging, and real-time scans

A Simple Campaign to Try​

Next time you want to promote something locally, try this:

  1. Pick 5 bulletin boards in different neighborhoods
  2. Create 5 unique QR codes, one per board
  3. Print 5 flyers with the same design but different codes
  4. Place them and record the date
  5. Check scans after 2 weeks
  6. Keep the top 2 boards, replace the bottom 3 with new locations

That's it. After one cycle, you'll know more about local marketing than most businesses.

Conclusion​

Community bulletin boards are not outdated. They're undermeasured.

A few dollars in flyers and a few hours of placement can produce a ranked list of your best local marketing real estate. The businesses that treat bulletin boards as a testable channel will consistently outspend their competitors more wisely than the ones still driving around town hoping something works.

Yap.Ad makes this easy. Create a unique QR code for each board, log where you placed it, and see real-time scans as they happen. No spreadsheet required.

Ready to find your best bulletin boards? Try Yap.Ad on your next local flyer campaign.
· 4 min read

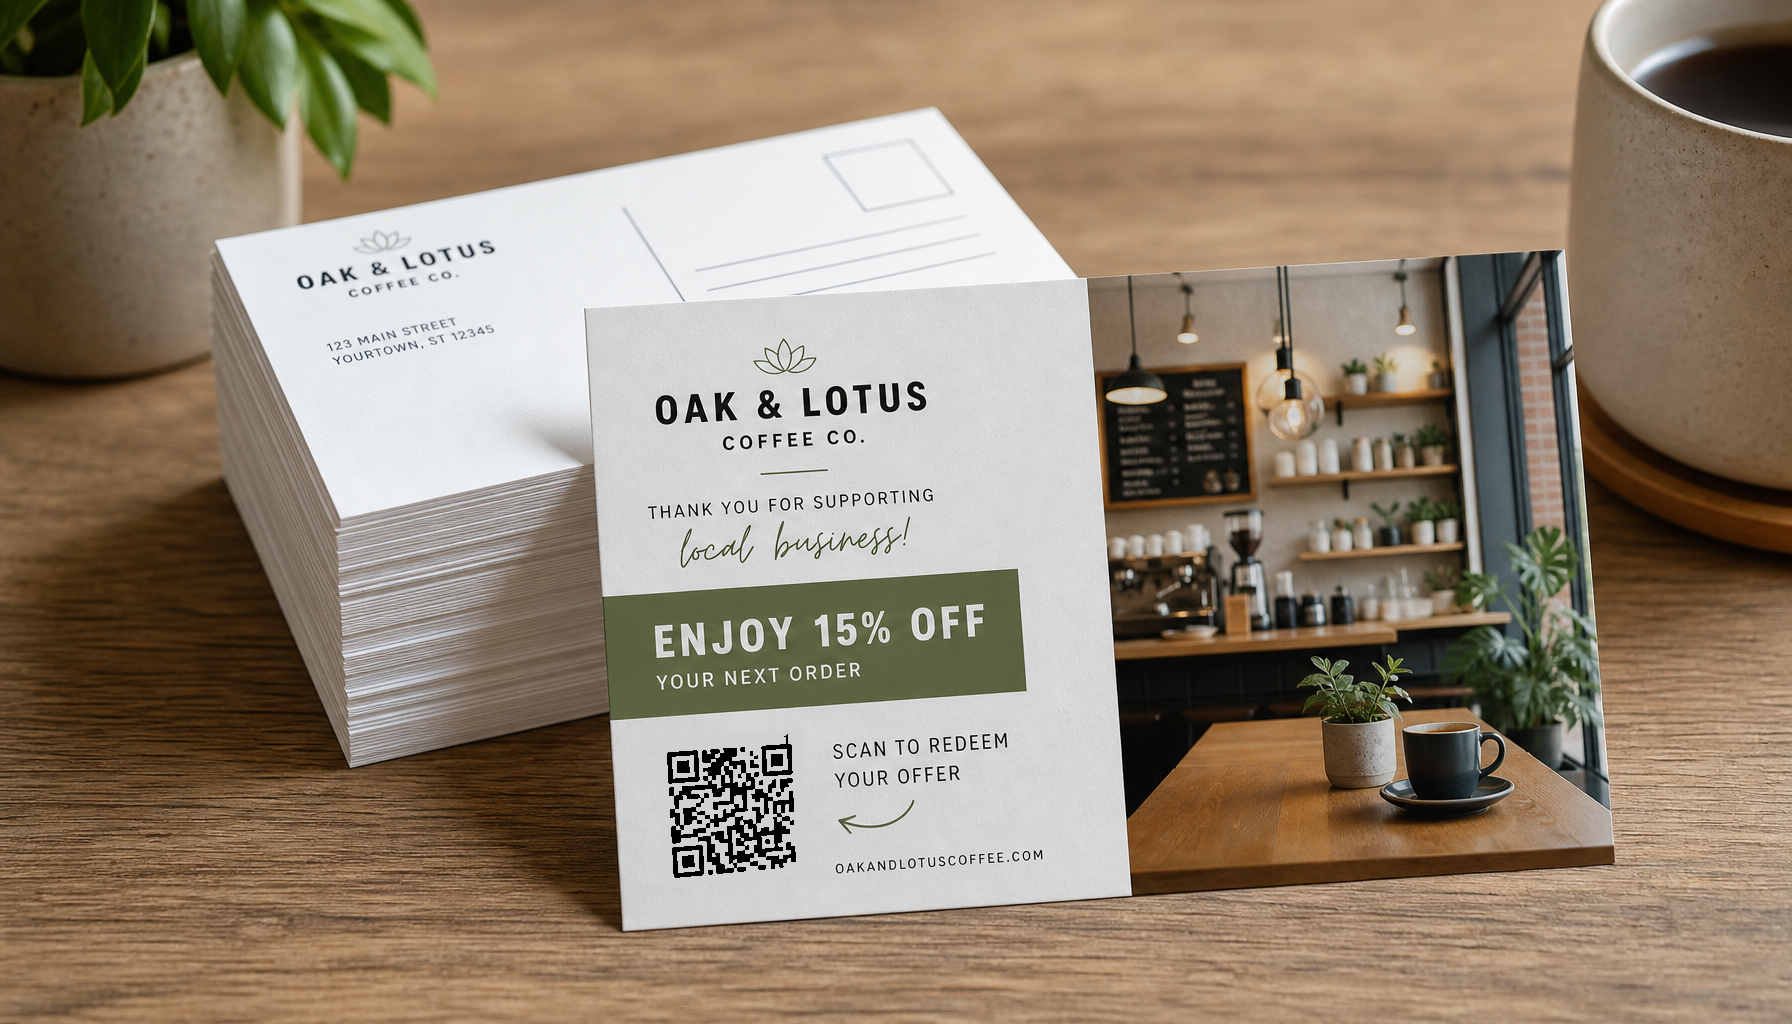
USPS Every Door Direct Mail (EDDM) is one of the cheapest ways to put a postcard in every mailbox in a neighborhood. At roughly $0.26 per piece, you can reach 5,000 homes for about $1,300 in postage. No mailing list, no permits, no guessing about coverage.

But EDDM has a hidden cost: it is completely blind.

You pay for every mailbox. The interested ones. The uninterested ones. The empty ones. The ones where your offer is irrelevant today and will be irrelevant next month. You get reach, but you get zero feedback.

Hero image

The 2% Problem​

A typical local EDDM campaign sees a response rate in the 1–3% range. Let's use 2% as a working number.

That means a 5,000-piece campaign produces about 100 engaged households.

The other 4,900 households, 98%, do not respond.

With traditional EDDM, you have no idea which 100 mattered. So next month you mail all 5,000 again. And again. You keep paying for silence.

Add a Unique QR Code per Route​

Yap.Ad changes the equation by giving each USPS carrier route its own QR code.

Now the same 5,000-piece campaign tells you:

  • Which routes produced scans.
  • Which routes produced nothing.
  • What time of day people scanned.
  • Whether they came back later.

The data flows into Google Analytics like any other campaign. You are no longer buying reach. You are buying a measured response.

The Math Flips​

Untracked EDDMEDDM + Yap.Ad
Pieces mailed5,0005,000
Postage$1,300$1,300
Known responses0100
Cost per engaged householdUnknown$13
Follow-up campaignMail 5,000 again ($1,300)Mail 100 engaged households (~$26)

That first $1,300 campaign is not an expense you repeat. It is an investment in a retargeting list.

Stop Paying for the 98%​

Once you know which routes respond, you can:

  • Drop underperforming routes from future mailings.
  • Re-target engaged households with follow-up offers at a fraction of the cost.
  • Test new creative on a small, proven-responsive audience before scaling.

A $1,300 EDDM blast buys you 100 known-interested households. Every follow-up to those 100 costs postage on 100 pieces, not 5,000. Over a year, that is not a small improvement. It is a different business model.

The Reset Problem​

People move. The Census Bureau reports that roughly 11% of Americans move each year, and renters turn over even faster. An engaged address from 18 months ago may now have a new occupant with different needs.

A good tracking system should reset engagement when a home sells or a unit rents to someone new. Yap.Ad can treat a new occupant as a fresh prospect, so you do not keep suppressing an address just because the previous tenant ignored you.

EDDM Gives You Reach. Yap.Ad Turns It into Intelligence.​

The cheapest reach in local marketing is only a good deal if you learn from it. Pair EDDM with route-level QR tracking and your next campaign is not a guess. It is a conversation with the people who already raised their hands.

Ready to stop mailing the 98%? Try Yap.Ad on your next EDDM campaign.

· 4 min read

Most businesses and organizations still rely on physical flyers, posters, and bulletin boards to reach local audiences. But there's a problem: once a flyer goes up, you have almost no idea if anyone looked at it, scanned it, or acted on it.

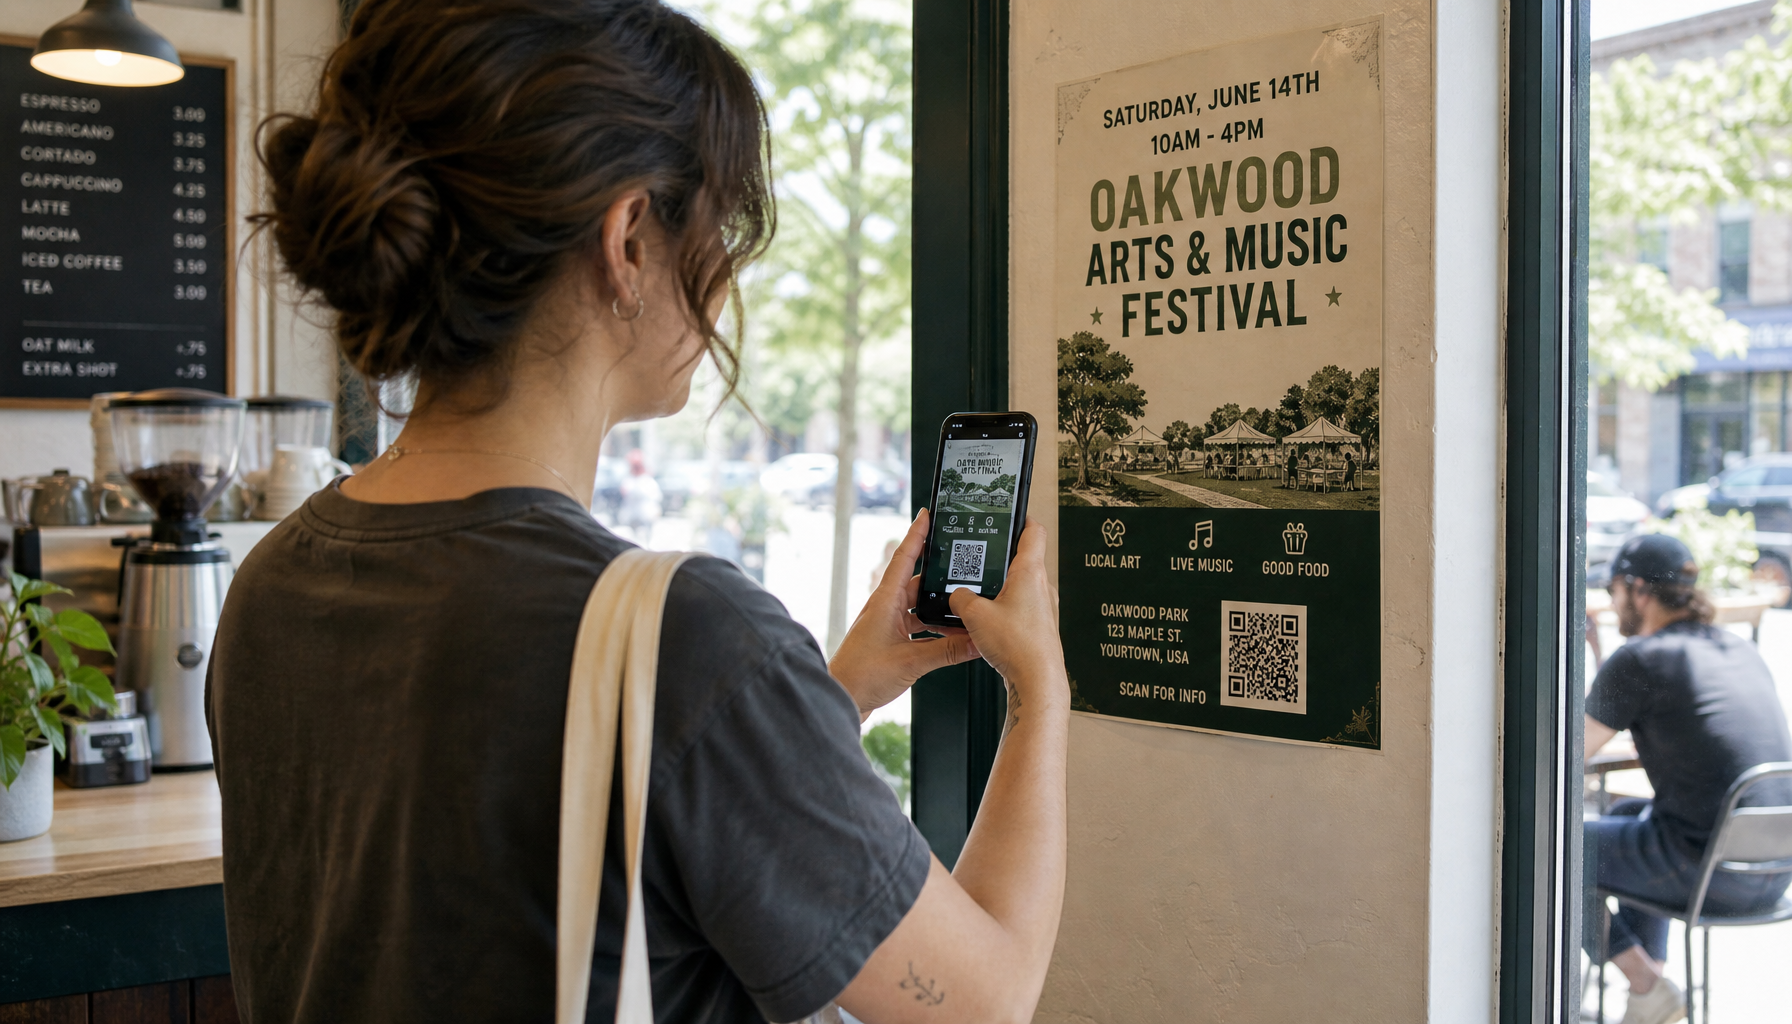
QR codes change that. With the right setup, you can turn every flyer into a trackable marketing channel and know exactly which locations drive traffic.

Hero image

Why Flyer Tracking Matters​

Imagine you print 500 flyers and post them across 20 locations. Without tracking, you only know two things:

  1. You printed 500 flyers.
  2. Hopefully, something happened.

With QR code tracking, you can answer questions like:

  • Which coffee shop produced the most scans?
  • Did the church bulletin board outperform the library?
  • Which neighborhood responded best?
  • What time of day do people scan?
  • Did the new flyer design perform better than the old one?

That data turns physical marketing from guesswork into a measurable channel.

What You Need​

To track flyers with QR codes, you need:

  1. A unique QR code for each location. Don't use the same QR code everywhere. If you do, you won't know which board performed best.
  2. A trackable destination. Each QR code should point to a landing page or website URL you can measure.
  3. An analytics tool. Google Analytics is the standard, but it has a 24–48 hour delay. For real-time tracking, use a tool like Yap.Ad that records scans as they happen.

Step-by-Step Setup​

Step 1: Design Your Flyer​

Keep it simple. A good flyer has:

  • A clear headline
  • One strong call to action
  • A large, scannable QR code
  • A short URL for people who prefer typing

Make sure the QR code is at least 1 inch square. Smaller codes are hard to scan from a distance.

Step 2: Create Unique QR Codes per Location​

For each bulletin board, poster location, or neighborhood, generate a unique QR code.

Use UTM parameters in your URL to make tracking easier in Google Analytics:

https://yoursite.com/?utm_source=flyer&utm_medium=qr&utm_campaign=launch&utm_content=coffee-shop-downtown

The utm_content parameter tells you which location the scan came from.

Step 3: Post the Flyers and Log the Locations​

When you place a flyer, record:

  • Venue name
  • Neighborhood
  • Date posted
  • Flyer design version
  • Estimated foot traffic

This metadata becomes important when you review the results.

Step 4: Monitor the Data​

Check your analytics dashboard daily for the first week, then weekly after that. Look for:

  • Total scans per location
  • Scan trends over time
  • Which designs or messages perform best
  • Locations where scans dropped off (the flyer may have been removed or covered)

Step 5: Iterate​

Use the data to improve:

  • Double down on high-performing locations
  • Replace or improve low-performing designs
  • Test new headlines or visuals
  • Expand to similar venues in the top-performing neighborhoods

Common Mistakes to Avoid​

  • Using one QR code for all locations. You lose location data.
  • Tiny QR codes. Make them easy to scan from a few feet away.
  • Broken links. Test every QR code before printing.
  • Ignoring context. A flyer at a gym performs differently than one at a coffee shop. Track the context, not just the scan count.
  • Giving up too early. Flyers often take days or weeks to accumulate scans. Let the data run before making big changes.

Tools That Help​

  • QR code generators: Most can create trackable codes, but they usually don't provide location-level data.
  • Google Analytics: Great for overall traffic, but delayed.
  • Yap.Ad: Built specifically for physical marketing attribution. Create unique QR codes per location, log placements, and see real-time scans.

Start Small​

You don't need a huge campaign to start tracking. Pick 5–10 locations, create unique QR codes, and run the campaign for two weeks. The lessons you learn will make every future flyer more effective.

Physical marketing isn't dead. It's just been hard to measure. QR codes fix that.


Want to track your next flyer campaign without building a spreadsheet? Yap.Ad gives every placement a unique QR code, logs where you put it, and shows you real-time scans. Start with your next 5–10 locations and see what actually works.

Book a free pilot → or start tracking now →

Get Early Access

Join the teams turning physical marketing into measurable data.

Have questions? Contact us at support@yap.ad